Coastal Video Surveillance
Team: D. Cullen, J. Konrad, T. D. C. Little
Funding: National Science Foundation, MIT SeaGrant “Consortium for Ocean Sensing of the Nearshore Environment”
Status: Completed (2011-2012)
Background: The monitoring of coastal environments is of great interest to biologists, ecologists, environmentalists, and law enforcement officials. For example, marine biologists would like to know if humans have come too close to seals on a beach and law enforcement officials would like to know how many people and cars have been on the beach, and if they have disturbed the fragile sand dunes. Due to large areas to monitor and a wide range of goals, an obvious sensing modality is a video camera. However, with 100+ hours of video recorded by each camera per week, a search for salient events by human operators is not sustainable. Furthermore, automated video analysis of maritime scenes is very challenging due to background activity (e.g., water reflections and waves) and a very large field of view.

Case study: The beach on Great Point, Nantucket, Massachusetts
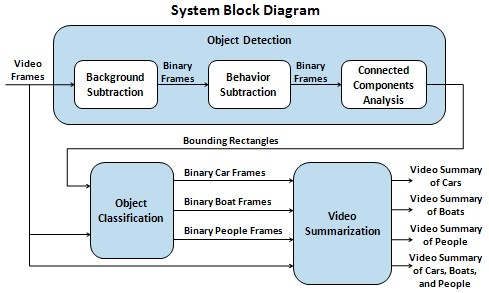
Summary: The goal of this research is to develop an approach to analyze the video data and to distill hours of video down to a few short segments containing only the salient events, allowing human operators to expeditiously study a coastal scene. We propose a practical approach to the detection of three salient events, namely boats, motor vehicles and people appearing close to the shoreline, and their subsequent summarization. This choice of objects of interest is dictated by our application but our approach is general and can be applied in other scenarios as well. As illustrated in the diagram, our approach consists of three main steps: object detection, object classification, and video summarization. First, the object detection block performs background subtraction to identify regions of interest, followed by behavior subtraction to reduce statistically-stationary motion (e.g., ocean waves), and then connected-components analysis to identify bounding rectangles around the regions of interest. Next, covariance matrix-based object classification is applied to classify each region of interest as a car, a boat, a person, or none of the above. Finally, video condensation by ribbon carving generates video summaries of each salient object, using the classified regions of interest for the input cost data. Our system is efficient and robust, as shown in the results below.

Block diagram of the proposed coastal surveillance system
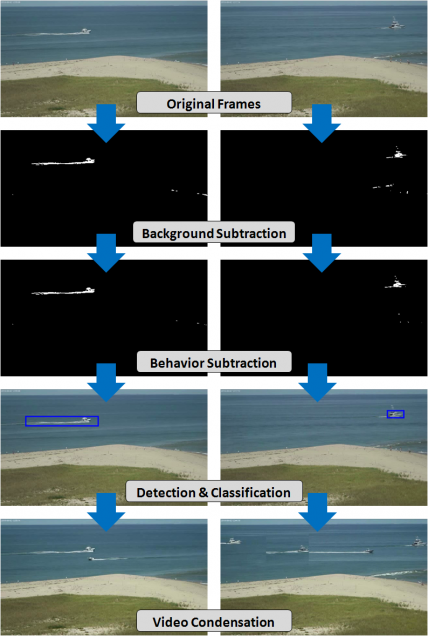
Results: We tested the effectiveness of our approach on long videos taken at Great Point, Nantucket, Massachusetts. Shown below are sample frames that illustrate the output of each processing step. The two columns show results from two different video sequences.

Output of subsequent processing steps
A few more examples of the object classification step are shown below. Blue identifies detections of boats, red identifies cars, and green identifies people.

Results of salient event detection and classification
The amount of summarization that we can achieve varies greatly with the amount of activity in the scene. However, even for frames with high activity, we achieved almost a 20x reduction in frame count. The table below gives summarization results for one video sequence.
| Results for video containing boats and people. Input: 38 minutes long at 5 fps, 640×360 resolution. |
||||||
| Cost function for video condensation |
Number of frames after each step | Condensation ratio (flex 3) |
||||
| input | flex 0 | flex 1 | flex 2 | flex 3 | ||
| Boats only | 11379 | 1752 | 928 | 723 | 600 | 18.97:1 |
| People only | 11379 | 3461 | 2368 | 1746 | 1285 | 8.85:1 |
| Boats or People | 11379 | 4908 | 3253 | 2504 | 1897 | 5.99:1 |
| Behavior Subtraction | 11379 | 11001 | 8609 | 8147 | 7734 | 1.47:1 |
We designed our approach with computational efficiency in mind. The table below shows execution time benchmark results. As we can see, video condensation is by far the most time-consuming step.
| Processing Step | Average Execution Time |
| Background Subtraction Behavior Subtraction Object Detection Video Condensation flex 0 Video Condensation flex 1 Video Condensation flex 2 Video Condensation flex 3 |
0.292 sec/frame 0.068 sec/frame 0.0258 sec/frame 0.034 sec/frame 2.183 sec/frame 1.1229 sec/frame 0.994 sec/frame |
| Total for all steps: | 5.058 sec/frame |
Below are sample videos to illustrate typical outputs at different stages of the method.
Original coastal video
Detected events (white) in the original video: boats, cars and people (waves are largely ignored). Time spans of events are: boats 0:40-1:13, vehicles 4:12-7:12, people 4:20-6:05, 6:25:6:35, 6:45-7:12
Events after classification: blue rectangles = boats, red rectangles = vehicles, green rectangles = people
Summary video of boats occurring in the original video sequence
Summary video of vehicles occurring in the original video sequence
Summary video of people occurring in the original video sequence
Publications:
- D. Cullen, J. Konrad, and T. Little, “Detection and summarization of salient events in coastal environments,” in Proc. IEEE Int. Conf. Advanced Video and Signal-Based Surveillance, Sept. 2012.
- D. Cullen, “Detecting and summarizing salient events in coastal videos,” Tech. Rep. 2012-06 (Master’s project), Boston University, Dept. of Electr. and Comp. Eng., May 2012.