Distance Estimation between People from Overhead Fisheye cameras (DEPOF)
Motivation
Measuring the distance between people indoors has gained importance in view of the recent pandemic. In the past, distance estimation methods have been proposed for rectilinear-lens cameras. However, a single rectilinear-lens camera cannot cover a large space due to its narrow field of view (FOV) unlike a camera equipped with a fisheye lens. To inspire research on the estimation of distance between people using a single overhead fisheye camera, we introduce a first-of-its-kind dataset: Distance Estimation between People from Overhead Fisheye cameras (DEPOF).
Description
DEPOF is composed of three main parts: (1) Calibration Data for Intrinsic Camera Parameters, (2) Training Data for Distance Estimation (Chessboard), (3) Testing Data for Distance Estimation (People)
- Calibration Data for Intrinsic Camera Parameters
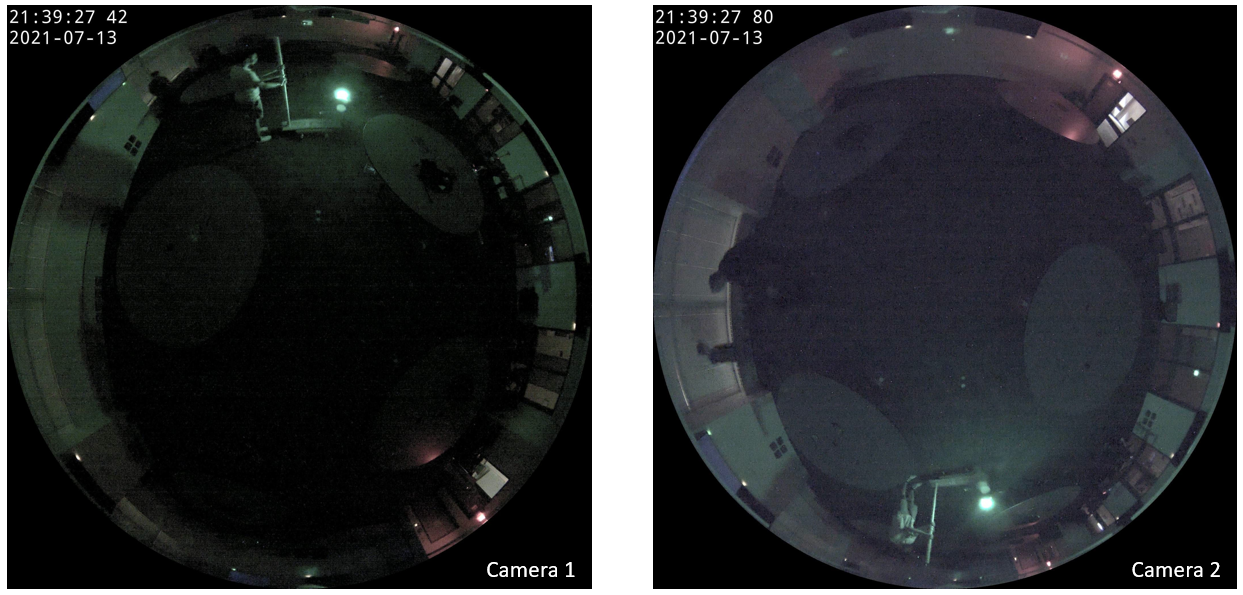
For some distance estimation methods, the knowledge of intrinsic camera parameters is necessary. In this part of DEPOF, we are providing data for learning these parameters. We moved a spherical LED light source mounted on a dolly at a fixed height in darkness in a large classroom and recorded images from 2 fisheye cameras mounted on the ceiling. These images are stored in the “LED_images” folder in the dataset. A sample pair of images are shown below. One can develop an algorithm to detect the LED light source in each image. However, we are also providing the pixel location of the center of the LED light source in each frame in a JSON file called “LED_Calibration_Cam1.json” and “LED_Calibration_Cam2.json”. This JSON file is structured as a dictionary where the “keys” are the names of the images from “LED images” folder and the “values” are the pixel coordinates of the center of the light source in [x, y] format.
Figure 1: Image examples from the data used for estimating the intrinsic camera parameters - Training Data for Distance Estimation (Chessboard)
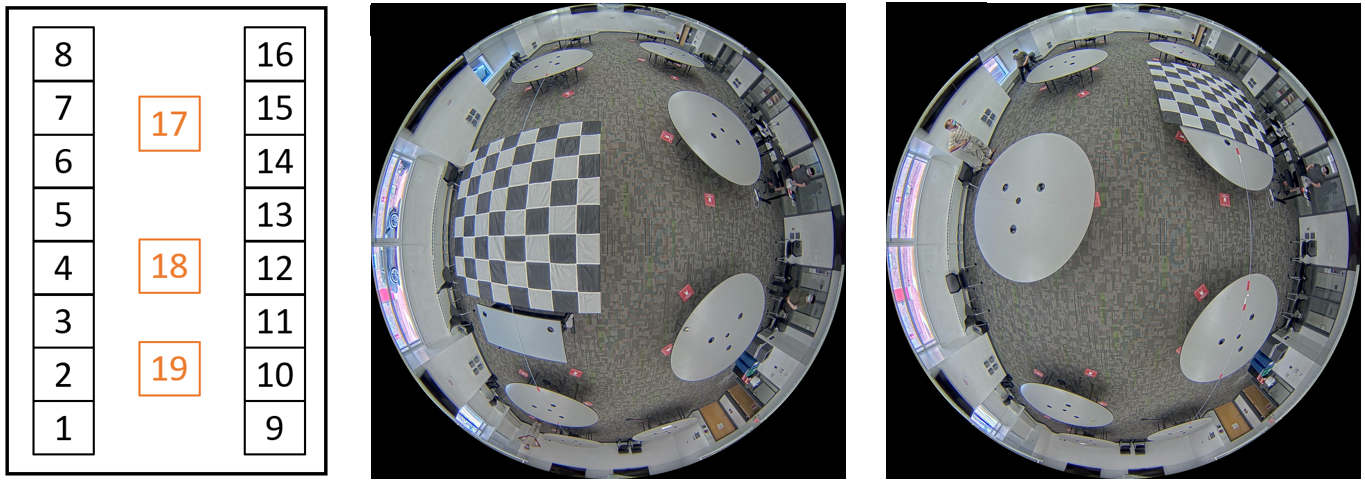
In this part of the dataset, we are providing pixel locations in images and their relative distance with respect to each other in the real world. To record this data, we moved a 9 ft x 9 ft chessboard at a constant height (32.5 inches) to 19 different locations around the room. Then, we labelled each corner of the chessboard. Since, we know the length of each square (12.5 inches) on the chessboard, we can tell the distance between any two points on the chessboard. Not only can we tell the distances within a chessboard, but we can also tell the distances between points on different chessboards since we carefully measured the chessboard displacement each time we moved it. Chessboard locations #1-16 have been carefully measured so the distance between any point pair is known. Chessboard locations #17-19 are independent of locations #1-16, so only distances between points within each chessboard are known. The images of this recording are stored in the “Chess mat_selected” folder and the annotations are in “Board_map.json”. The annotations are structured as a dictionary, the “keys” are the locations of the boards (e.g. Board1, Board2, Board3, etc.), and the “values” are arrays of pixel coordinates. In each array of pixel coordinates, the first pair of coordinates corresponds to the upper-left corner of the chessboard, the second pair corresponds to the second left-most corner on the first row, the third pair corresponds to the third left-most corner on the first row until the end of the row. Then, the sequence repeats from from the left on the second row, and so on. If this is not clear, we suggest opening one of the chessboard images and inspecting where the annotations are located on the image.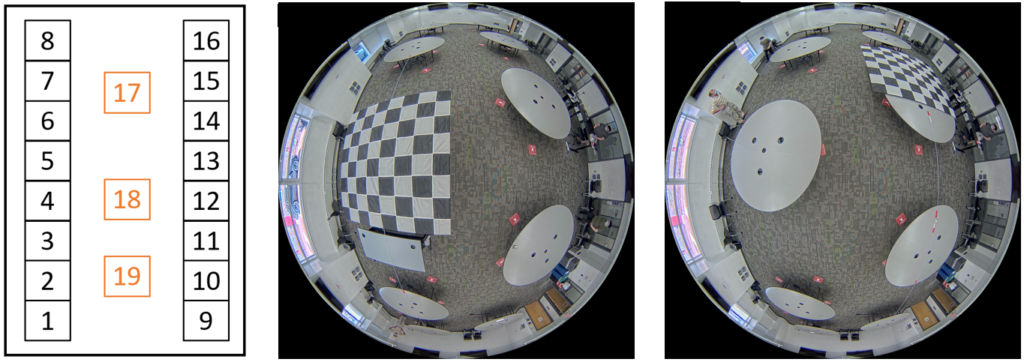
Figure 2: Examples of chessboard locations used for training - Testing Data for Distance Estimation (People)
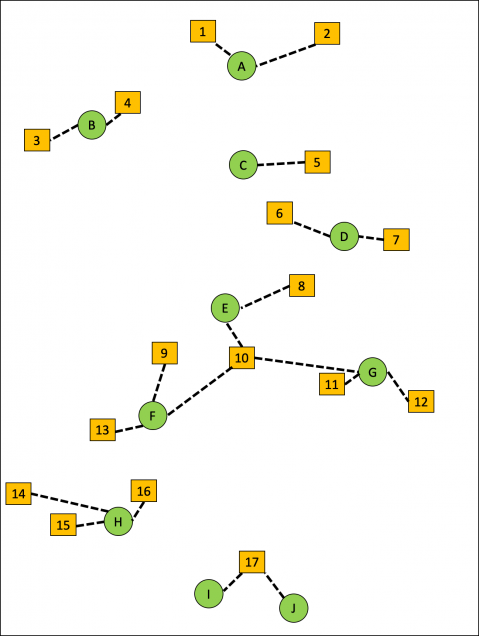
We collected the testing part of the dataset with people in a 72 ft × 28 ft classroom. First, we marked locations on the floor where individuals would stand (see Figure 3). We measured the distances between all locations marked by a letter (green disk) which gives us 45 (10 choose 2) distances that are distinct. For locations marked by a number (yellow squares), we measured the distances along the dashed lines (20 distinct distances). Using this spatial layout, we collected and annotated two subsets of data:
-
- Fixed-height dataset: One person of height H = 70.08 inches moves from one marked location to another location and an image is captured at each location. This allows us to evaluate our algorithms on people of the same known height.
- Varying-height dataset: Several people of different heights stand at different locations in various permutations to capture multiple heights at each location. We use this dataset to evaluate sensitivity of our algorithm to a person’s height variations.
In addition to the 65 distances (45 + 20), we performed 8 additional measurements for the fixed-height dataset and 2 additional measurements for the varying-height dataset.
Depending on their location with respect to the camera, a person may be fully visible or partially occluded (e.g., by a table or chair). In order to understand the impact of occlusions on distance estimation, we grouped all the pairs in both testing datasets into 4 categories as follows:
-
- Visible-Visible (V-V): Both people are fully visible.
- Visible-Occluded (V-O): One person is visible while the other one is partially occluded.
- Occluded-Occluded (O-O): Both people are partially occluded.
- All: All pairs, regardless of the occlusion status.
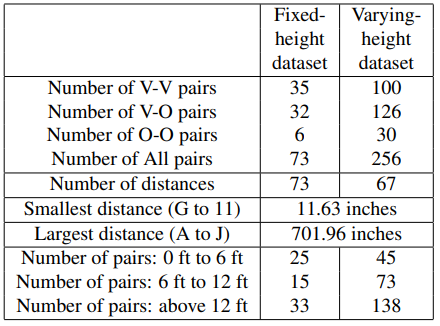
We are sharing the fisheye frames for these data subsets in “Fixed_Height_Frames” and “Varying_Height_Frames”, and the annotations in “Fixed_Height.json” and “Varying_Height.json”. The annotations are structured as dictionaries, where the “keys” are the point locations as strings (e.g. “A-B”, “E-I”, “D-7”, etc.), and the “values” are arrays in the following format: [bounding_box_info_1, bounding_box_info_2, distance, visibility label], where “bounding box info” is an array in the following format [x-coordinate of the center of the bbox, y-coordinate of the center of the bbox, width of bbox, height of the bbox, angle of the bbox] (check CEPDOF dataset for more information about bounding boxes), “distance” is the true real-world distance measured by an electronic measuring tape, and “visibility label” is one of the above options (V-V, V-O, O-O). Below are shown statistics of these data subsets:
Dataset Download
You may use this dataset for non-commercial purposes. If you publish any work reporting results using this dataset, please cite the following paper:
Z. Lu, M. Cokbas, P. Ishwar, and J. Konrad, “Estimating Distances Between People using a Single Overhead Fisheye Camera with Application to Social-Distancing Oversight,” in 18th International Conference on Computer Vision Theory and Applications (VISAPP), February 2023.
To access the download page, please complete the form below including the captcha.
DEPOF Download Form
Contact
Please contact [mcokbas] at [bu] dot [edu] if you have any questions.
Acknowledgements
The development of this dataset was supported in part by the Advanced Research Projects Agency – Energy (ARPA-E), within the Department of Energy, under agreement DE-AR0000944. We would also like to thank Boston University students for their participation in the annotation of our dataset.