Image Analysis for Hoarding Assessment
Team: M.O. Tezcan, A. Tooke, Z. Liu, J. Muroff (School of Social Work), J. Konrad
Funding: College of Engineering Dean’s Catalyst Award and Digital Health Initiative, Boston Univ.
Status: Ongoing (2015-2020)
This project is a multidisciplinary collaboration between the College of Engineering and the School of Social Work at Boston University.
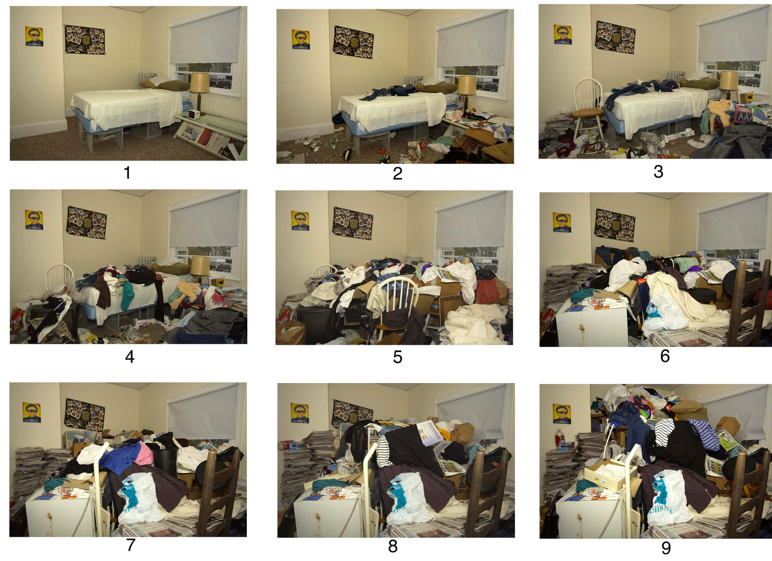
Background: The hoarding disorder (HD) is a serious psychiatric condition and public-health problem characterized by persistent difficulty discarding ordinary items and substantial clutter that impairs daily functioning. HD is distinct from many psychiatric disorders due to its profound negative effect on the health, safety, and well-being of clients and their homes, their neighbors, and the broader community. Safety risks in hoarded homes include fires, falls, and entrapment in falling piles of clutter, endangering the residents of the cluttered home, neighbors, and emergency responders. Today, HD symptoms are typically assessed using self-report and clinical interview instruments. Given the visual aspect of HD, the Clutter Image Rating (CIR) scale was developed by R.O. Frost, G. Steketee. D.F. Tolin and S. Renaud. This pictorial instrument includes sets of 9 “clutter-equidistant” photos for each of 3 rooms (bedroom, living room, kitchen) that are used to rate clutter severity (see image below). Ratings may be provided by clients, practitioners, family members, etc., and, therefore, may be biased.
Summary: In order to provide automatic and objective CIR assessment, we have developed two data-driven approaches to rating room clutter from images. While, ideally, the goal is to perfectly classify clutter as an integer value between 1 and 9, trained professionals admit assigning CIR values within ±1. Therefore, we define the CIR assessment problem as multi-label, rather than single-label, image classification.
HOG+SVM approach: In this approach, we use Histogram of Gradients (HOG) to extract a feature vector from each image and apply the Support Vector Machine (SVM) as classifier. We apply the following augmentations: horizontal and vertical shifts by 0, 5, 10, 15 pixels, and horizontal flip. This results in 32 augmented images for a single training image. SVM training is performed using Gaussian RBF kernel with optimal parameters found via grid search.
CNN approach: We chose ResNet18 for its excellent image recognition performance and also because it employs significantly fewer parameters than many competitors. This is important since our dataset (see below) is relatively small and even with fewer parameters training ResNet18 from “scratch” is not possible. One of the commonly-used approaches in this case is transfer learning, i.e., the transfer of knowledge gained in a similar task completed on a large dataset. Therefore, we start the training from the final ResNet18 weights obtained for ImageNet classification and fine-tune them on images
from our hoarding dataset. As the loss function, we use a linear combination of two loss functions: Ls for single-label classification (allowing only a single CIR value from 1 to 9 to be selected) and LM for multi-label classification (allowing three consecutive CIR values to be selected, e.g., 3,4,5, by means of three-hot encoding). As Ls we use cross-entropy between the softmax output of ResNet’s last layer and a one-hot encoded ground truth, while as LM we use multi-label, binary cross-entropy between the sigmoid output of ResNet’s last layer and a three-hot encoded ground truth (for mathematical details see the paper below). The final loss function is defined as follows: L = (1-λ)Ls +λLM, where λ is a parameter the can be used to control performance. During training, we use the final weights obtained in ImageNet competition as the initial weights for our ResNet18 networks. Then, we fine-tune these weights using our hoarding-image dataset. We apply data augmentation through random image cropping and horizontal flipping like in the HOG+SVM method.
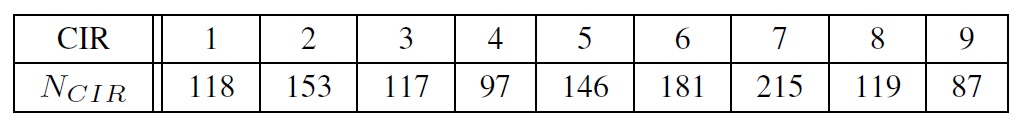
Hoarding-image dataset: Collecting a large dataset of hoarding images is highly nontrivial. It is extremely difficult to find images of hoarding scenarios for CIR values of 7 or higher. Furthermore, assigning the ground-truth CIR rating to hoarding images is a labor-intensive process that requires time of a trained professional. We introduced the first dataset of this type in [Tooke, Konrad, Muroff], but it contained only 620 images, not enough for training a CNN and obtaining reliable results. Recently, we have expanded this dataset by collecting more images from the internet, carefully pruning all image replications and rating them with help from trained professionals. The new dataset contains 1,233 labeled images; the number of images per CIR rating is shown in the table below.
Experimental Results: We used the above hoarding dataset in all our experiments. In order to obtain a CIR estimate for each image, we applied 4-fold cross-validation with non-overlapping splits. In order
to produce accurate performance metrics, we repeated this procedure 5 times, each time generating the 4 splits randomly, and averaged the results. Since the dataset is small, we did not use any test set for this would reduce the training set further.
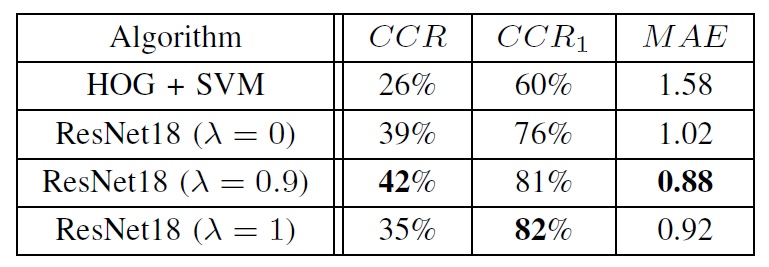
The table below compares the performance of our algorithms in terms of the Mean Absolute Error, Correct Classification Rate (CCR) and its variant that we call CCR1, which for CIR value of K considers K-1, K and K+1 as correct classifications. For mathematical definitions please see [Tezcan, Konrad, Muroff]. Although CCR is a critical performance measure for classification tasks, it is less so for CIR assessment as there can be ±1 ambiguity, even in the ground truth. Therefore, CCR1 and MAE need to be considered as well. Clearly, the three CNNs, each with a different value of λ, outperform HOG + SVM in all three metrics. The best CCR1 we obtained is 82%, and the lowest MAE value is 0.88. In other words, an image representing room clutter is classified in terms of CIR within 1 of the correct value in 8 out of 10 tries. This is in stark contrast to 60% CCR1 and 1.58 MAE for the baseline HOG + SVM algorithm.
Automatic CIR estimation can be a valuable tool in HD treatment. It removes the need for human-based scoring (cost, bias, repeatability issues), thus simplifying assessment and monitoring of treatment progress while facilitating real-time feedback. Methods proposed here are a promising step in this
direction but in order to further advance their accuracy alternative architectures need to be considered and, certainly, more data need to be collected.
Publications:
- Z. Liu, “Clutter detection in indoor scenes using Structure 3-D sensor,” Tech. Rep. 2015-04, Boston University, Dept. of Electr. and Comp. Eng., May 2015.
- A. Tooke, J. Konrad, and J. Muroff, “Towards automatic assessment of compulsive hoarding from images,” in Proc. IEEE Int. Conf. Image Processing, Sept. 2016.
- J. Muroff, J. Konrad, M. Tezcan, and L. Heller, Enhancing hoarding disorder assessment through automated rating of room clutter. 51st Annual Convention of the Association for Behavioral and Cognitive Therapies, San Diego, CA, Nov. 2017.
- M. Tezcan, J. Konrad, and J. Muroff, “Automatic assessment of hoarding clutter from images using convolutional neural networks,” in Proc. IEEE Southwest Symposium on Image Analysis and Interpretation, Apr. 2018.